An epidemic ends once the spread of the infection stops and most of the population has either developed immunity or has been vaccinated. It may also end when the number of those recovered passes a certain threshold. At that point, the population achieves something called “herd immunity.” Imagine a person that has never been exposed to the disease and is therefore susceptible. If that person only interacts with others who are immune to the disease, there is no way the disease can find a path to infect him or her. The person who has never been exposed has effective immunity by way of the people he or she interacts. In the absence of a vaccine or an effective treatment that can reduce the mortality to near zero, herd immunity is the best chance we have against a disease such as COVID-19. (It is important to note that the infection may continue to spread but at significantly slower rate.)
Typically, we know little about the disease when we encounter a new epidemic and assume the infection will affect everyone equally. Consider the case for COVID-19 and assume that herd immunity will be achieved when 75% of the population is infected. For a population of 100,000 and a mortality rate 0.4%, the number of deaths could be as high as 300 (0.4% X 75% X 100,000) before herd immunity is reached. Now let’s assume 30% of a certain segment of the population contracts the disease with a mortality rate 10 times higher than the rest of the population. Isolating only the vulnerable group while allowing the rest of the population to first achieve herd immunity will result in a total death toll around 130. The reason is because the 70,000 less vulnerable have a lower mortality rate.
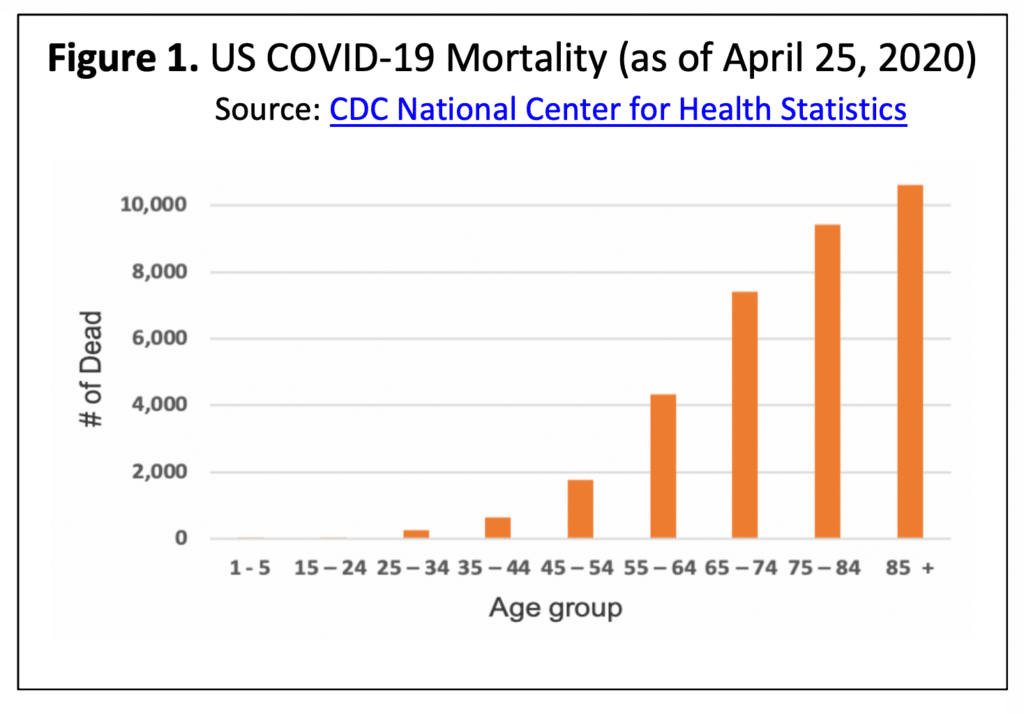
In Figure 1, we show the US Mortality rate due to COVID-19. One can easily observe that almost 80% of deaths occur amongst those over the age of 65. This group is most vulnerable and is a relatively small percentage (about 16%) of the total US population. In other words, 80% of all COVID-19 deaths come from 16% of the population. Following a similar plan of action as the one used in Sweden, the following strategy would emerge:
- Strictly isolate everyone over the age of 65 or those with serious underlying health condition. Ensure their caregivers test negative or have the antibody against COVID-19. Caregivers must take all necessary precautions not to pass on any infections to this vulnerable group.
- Allow the rest of the 84% of the population to help restart the economy. They can go back to work if they choose while wearing masks and maintaining hygiene standards.
This is the strategy attempted in Sweden. On April 28, 2020, Anders Tegnell, Chief Epidemiologist at Sweden’s Public Health Agency, told USA Today, “We think up to 25 percent of people in Stockholm have been exposed to Coronavirus and are possibly immune. We could reach herd immunity in Stockholm within a matter of weeks.” Except they were not able to fully protect their older, vulnerable population. According to Dr. Anders Tegnell, more than half of all deaths in Sweden have occurred in elderly care homes. Nonetheless, Sweden ended up with a similar mortality rate as the rest of Europe, but without shutting down their economy.
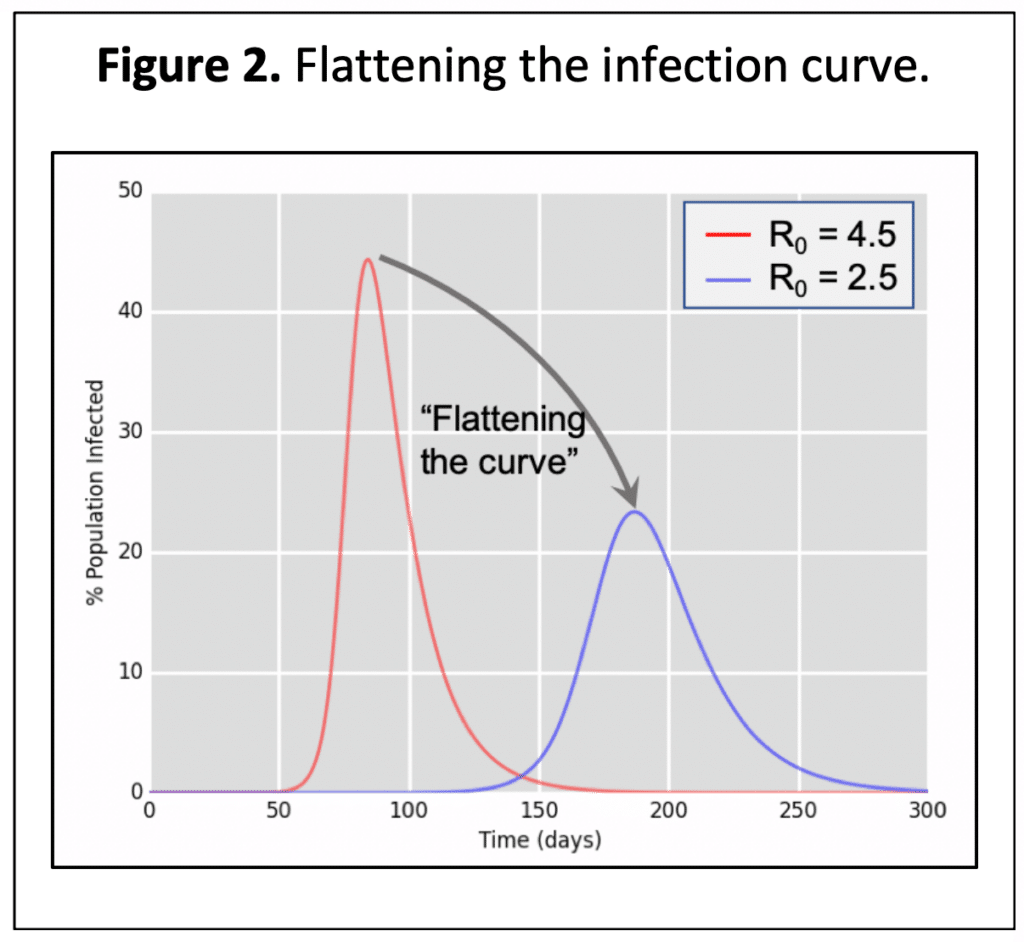
The strategy used in the US has been to “lockdown” with a “Shelter in Place” order. This is slowing down the rate of infection by changing the reproductive rate (the number of new infections from each infected person). It is important to note that “flattening of the curve” does not reduce the overall number of infections; we are just kicking the can down the road.
The key reasons for a lockdown are as follows:
- It avoids overwhelming the hospitals by lowering the peak of the infection to a level below the healthcare facilities’ capacity.
- It gives the medical staff the opportunity to better prepare for expected number of patients by creating special isolation facilities and increasing capacity with the addition of new beds.
- It gives the medical staff the opportunity to work out treatment plans for a variety of cases and anticipated complications.
The health, social and economic impact associated with lockdown must be taken into account when deciding the duration of the isolation. The initial report by the World Health Organization (WHO) that drove many of the early decisions was based on an inaccurate estimate of a 3.4% mortality rate in COVID-19 patients.
COVID-19 is far less deadly than originally assumed based on initial data.
There is now strong evidence that the mortality rate is far lower than first stated by WHO.
A study published this week by the University of Southern California and the Los Angeles County Department of Public Health estimated the virus is significantly more prevalent in the county than the number of confirmed cases indicate. The study tested 863 adults for the presence of antibodies to the SARS-Cov-2 virus. The research team, led by Prof. Neeraj Sood of USC Price School for Public Policy, showed approximately 4.1% of the county’s adult population has an antibody to the virus. Correcting for a statistical margin of error, the research team concluded about 2.8% to 5.6% (or 221,000 to 442,000) of the county’s adult population has contracted the virus. This estimate is 28 to 55 times higher than the 7,994 confirmed cases of COVID-19 reported at the time of the study in early April. The number of COVID-19 related deaths in the county has now surpassed 600. This implies a case mortality rate of 0.13% to 0.27%, which is an order of magnitude less than WHO’s original report.
A similar study conducted by Stanford University tested randomly selected people in Santa Clara County. The results indicated that 2.49% to 4.16% of the population had been infected with SARS-Cov-2 virus by April 1st. Santa Clara had 1,094 confirmed cases with 50 reported deaths or a 4.6% case fatality rate (CFR). The Stanford results projects, based on the total population of Santa Clara County, an infection rate between 48,000 and 81,000. This projection is 50 to 85 times than the 956 confirmed cases. These results indicate a CFR between 0.06% and 0.10% and suggests the same range as Influenza.
On April 20th, New York began a statewide antibody study and collected around 3,000 samples from 40 locations in 19 counties across the state. The results indicate 21% of New York City’s population had antibodies against the SARS-Cov-2 virus which is at least 10 times higher than the official number of confirmed cases.
Vaccines for COVID-19 are at least a year away.
The first series outbreak of Coronavirus this century was the Severe Acute Respiratory Syndrome, SARS-Cov-1, in 2003. It was followed by the Middle East Respiratory Syndrome, MERS in 2012, and eventually found its way to other countries. There were serious efforts towards developing vaccines for both SARS-Cov-1 and MERS, and despite progress, none became available. The normal timeframe for developing a vaccine to be used in a mass vaccination campaign is 12 to 18 months. Removing some of the restrictions and fast-tracking development steps may accelerate the time to get a vaccine to clinical testing. However, it is unlikely one will be available before November 2020.
We are much closer to herd immunity than we think.
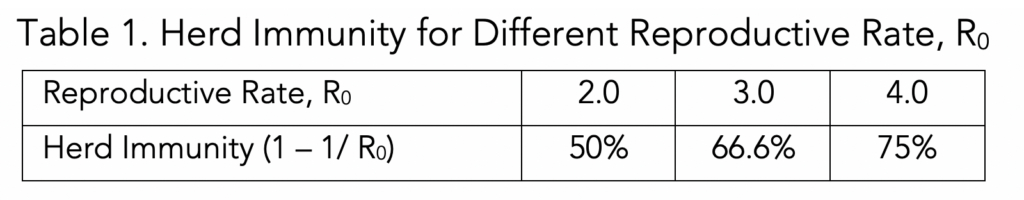
The SIR model, first introduced in 1927 by Kermack and McKendrick, is a set of equations applied to predict the progression of diseases, especially those that are airborne. S, I and R represent the number of people Susceptible, Infected, and Recovered. The model depends on two key parameters: duration of the disease (for COVID-19, we assume 14 days) and the reproduction number, R0 (the number of new cases from a single infected individual). The spread of infection stops (or reaches a minimum) when there are a sufficient number of people who have recovered and no longer spread the infection, herd immunity is reached. According to the model, the recovered percentage of the population at the point of herd immunity is related to the reproduction number, R0. For example, if R0 = 2, the recovered percentage of the population must be 50% or more. See Table 1 below.
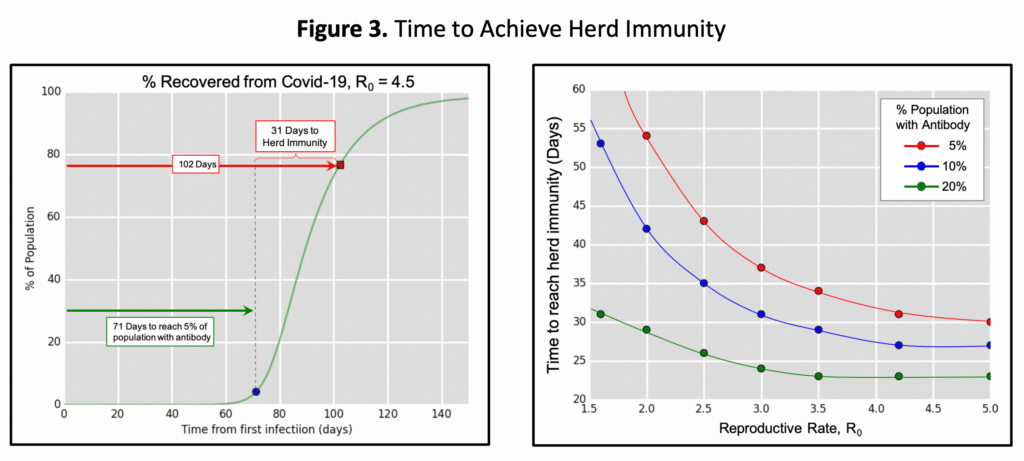
This model is not linear, meaning it takes much less time to go from 5% recovered rate to 50% than it takes to go from the first infection to 5%. Recent studies indicate California may be at or close to 5% while New York is at 13-21%. The key question, therefore, is how long will it take to achieve herd immunity? Using this model, we can calculate the time to reach herd immunity from when we are at 5%, 10% and 20% recovery levels. The result, illustrated in Figure 3, shows that when 5% of the population has already been infected (e.g. In California as indicated by recent antibody tests), we may be anywhere from 31 to 55 days to achieving herd immunity depending on the actual reproductive numbers that could be ranging from 4.5 down to 2.0. The lower the reproductive number, the farther away we are from herd immunity. Similarly, with 21% of New York City’s population tested positive for antibodies they are much closer to herd immunity (anywhere from 3 to 5 weeks away).
Conclusion
At this point in time, the lockdown may be:
- keeping us from achieving herd immunity,
- damaging our economy and devaluing the assets of our country,
- damaging our healthcare system and preventing our population from receiving proper healthcare outside of COVID-19.
Having vaccine available for mass inoculation before November 2020 is improbable. Therefore, we must remove the “Shelter in Place” restriction imposed on the population and reopen the economy.
We need to continue to isolate those over the age of 65 but reopen the economy, allowing those under 65 to go back to work while taking all reasonable precautions that would keep them from getting infected.
Bahram Nour-Omid is the Executive Chairman of the Board and Cofounder of Vitalacy, Inc.
Request a demo of Vitalacy’s Automated Hand Hygiene Monitoring Solution today!